SECTION 1: THE STAKES — WHY ECOSYSTEMS ARE ECONOMIES
Marine tourism is not a minor economic footnote. Coastal tourism and recreation contribute over $400 billion annually to the U.S. economy and support millions of jobs in communities where the ocean is the entire economic foundation. For these communities, a reef, a whale population, or a shellfish bed is not just ecologically interesting — it is the payroll.
What makes coastal economies unusual is the depth of their dependency on living systems. A manufacturing town can switch products. A coastal town whose identity is "go see the orcas" or "eat the lobster" cannot easily pivot when the orcas stop showing up or the lobster harvest is closed. The simulator you are about to use makes this dependency visible in dollar terms.
ECONOMIC VULNERABILITY VS. ECONOMIC SIZE
A community's economic vulnerability is not the same as its total revenue. A small town where 90% of income comes from whale watching tours is far more vulnerable to a whale prey mismatch than a large city where whale watching represents 3% of a diversified economy — even if the large city loses more total dollars. The simulator shows you both: the dollar loss AND the percentage impact on each sector. Pay attention to both numbers.

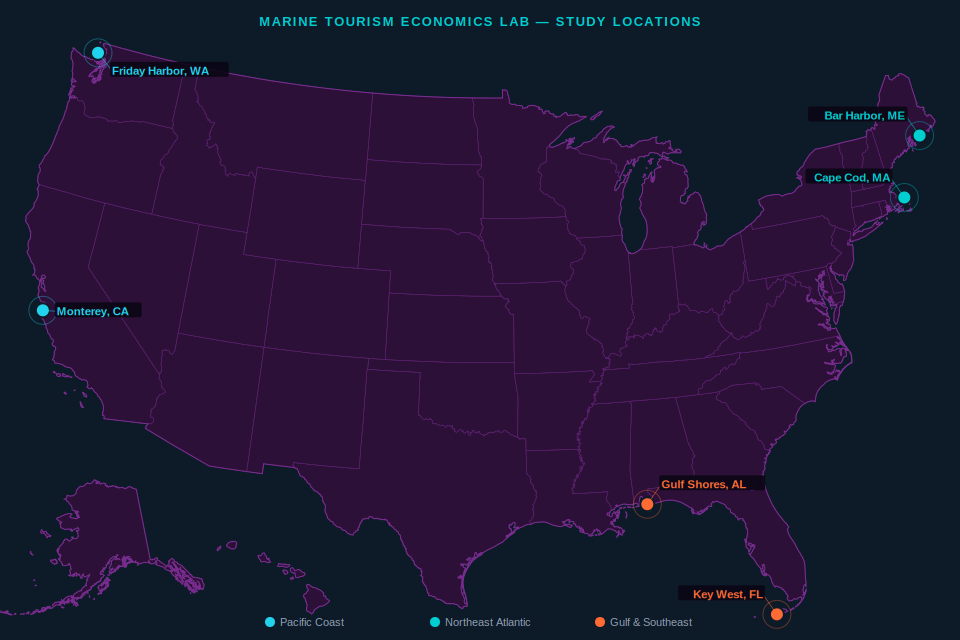
SECTION 2: THE SIX COASTAL ECONOMIES
The simulator uses six real U.S. coastal communities with revenues anchored to data from the National Ocean Economics Program (NOEP). Each community has a distinct portfolio of tourism sectors — and a distinct vulnerability profile. Click on any card in the simulator to switch locations.
$118M Sport Fishing · $82M Shellfish
$42M Whale Watching
$78M Eco-Tours/Kayaking · $32M Whale Watching
$285M Seafood Dining · $265M Water Sports
$290M Reef Diving/Snorkel · $238M Seafood Dining
$228M Sport Fishing
$42M Sport Fishing · $36M Orca Watching
$24M Lodging/General
$98M Diving/Eco-Tourism · $78M Sport Fishing
$52M Whale Watching
READING THE NUMBERS
Before you use the simulator, take a moment to notice the range of baseline revenues: Gulf Shores at $2.76 billion per year vs. Friday Harbor at $212 million. Now notice Friday Harbor's Orca Watching sector: just $36 million out of $212 million total — about 17% of the economy. A single ecological event (prey mismatch) can reduce that sector by 90%. Seventeen percent of a small economy disappearing is a community crisis, even if the dollar number seems modest. Gulf Shores's Beach Tourism alone earns more in a month than Friday Harbor earns all year.
SECTION 3: THE SIX DISRUPTION EVENTS
The simulator models six ecological events that are all currently occurring somewhere in U.S. coastal waters. Each slider runs from 0% (no disruption) to 100% (full-severity event). The percentages represent the fraction of the maximum documented economic impact for that event type. Click any card to read the ecological mechanism.

One of the most important things the simulator reveals is that different events have very different recovery timelines — and the same event recovers differently depending on location. The table below shows approximate recovery time (years to 90% revenue recovery) for each event at each location.
| Event | Cape Cod | Gulf Shores | Friday Harbor | Key West | Bar Harbor | Monterey |
|---|---|---|---|---|---|---|
| 🐋 Whale-Prey Mismatch | 4 yr | 1 yr | 6 yr | 1 yr | 4 yr | 4 yr |
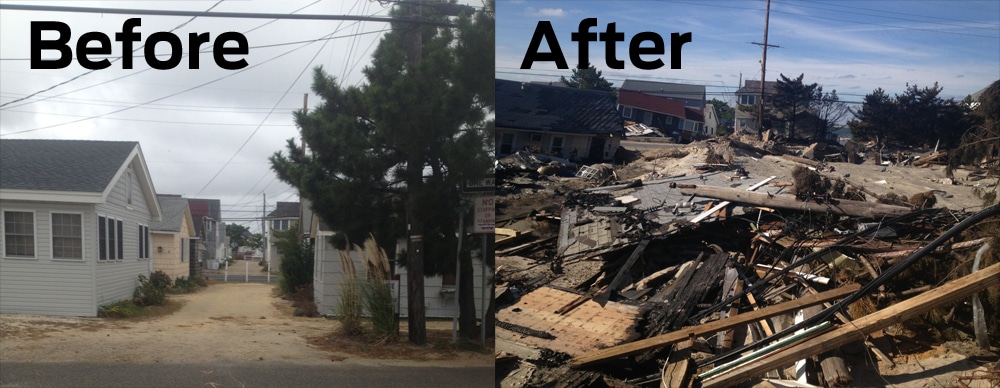
| 🌀 Hurricane | 3 yr | 4.5 yr | 1.5 yr | 4.5 yr | 2 yr | 1.5 yr |
| 🦪 Shellfish HAB | 2 yr | 2 yr | 2 yr | 1.5 yr | 2 yr | 2 yr |
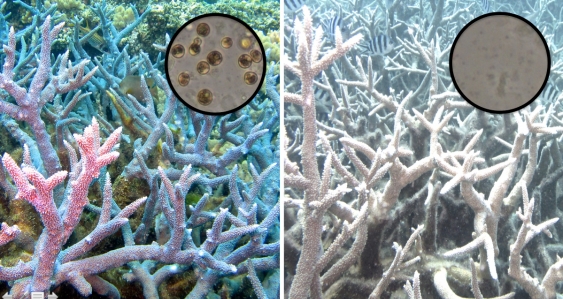
| 🪸 Coral Bleaching | 1 yr | 2 yr | 1 yr | 12 yr | 1 yr | 4 yr |
| 🛢️ Oil / Chemical Spill | 4 yr | 5 yr | 4 yr | 5 yr | 4.5 yr | 4.5 yr |
| 🟤 Algal Bloom (Visual) | 2 yr | 3 yr | 2 yr | 3 yr | 2 yr | 2 yr |
Recovery time = years until 90% of baseline revenue is restored. Values reflect documented real-world analogs. Key West coral bleaching (12 yr) reflects ongoing Florida Keys reef collapse — not a hypothetical.
SECTION 4: KEY VOCABULARY
Flip each card to reveal the definition. These terms will appear in your lab worksheet and are essential for writing precise answers.
CLICK ANY CARD TO FLIP
THE COMPOUND EVENT FORMULA
When two or more events are active simultaneously, the simulator uses independent probability reduction to calculate the combined impact. For each sector, it calculates: combined loss = 1 − (1 − loss_A) × (1 − loss_B). This means the second event hits whatever revenue is left after the first — not the full baseline. The result is always less than simply adding the two losses together. This reflects how real disasters work: a hurricane and a HAB in the same season hit the same depleted revenue base.
SECTION 5: BEFORE YOU START THE SIMULATOR
A few orienting ideas to carry into the lab:
WATCH FOR SECTOR CONCENTRATION
The most important thing to notice is not which location loses the most dollars — it is which location has the fewest alternative revenue sources when one sector collapses. When Friday Harbor loses Orca Watching, there is no other $36M sector waiting to absorb that hit. When Gulf Shores loses part of Beach Tourism, it still has hundreds of millions of dollars in Fishing Charters, Water Sports, and Seafood Dining. Concentration = vulnerability.
DOLLAR LOSS ≠ PERCENTAGE LOSS
The bar chart shows both baseline (faint outline bar) and current revenue (colored bar). The damage table shows both dollar loss and percentage loss. These often tell different stories. A 92% loss of Shellfish revenue at Cape Cod is only $75M — a number that sounds manageable until you remember the fishing families, processing workers, and restaurants whose entire livelihood depends on that sector. Always read both the percentage and the dollar number.
THE RECOVERY CURVE MATTERS AS MUCH AS THE INITIAL LOSS
The line chart models 5-year revenue recovery after the worst active event. A 30% loss with a 6-year recovery is economically more devastating than a 50% loss with a 1-year recovery. Look at the recovery chart, not just the bar chart. Key West under coral bleaching barely moves over 5 years — that is a community in a multi-year economic emergency, not a short-term hit.